Astral Reports - Help V5:
Watch the video
Select the first cell and click ‘Insert Function’ on the ribbon.
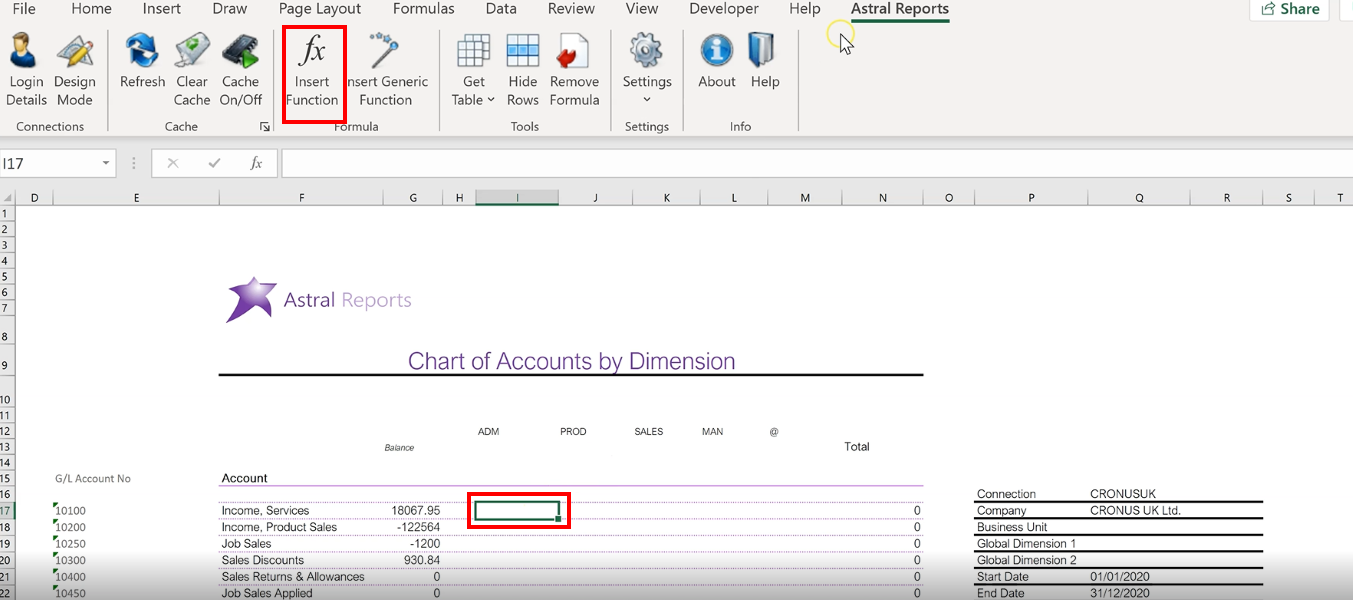
Figure 1
Scroll down to ‘BC_GLAmount’ and click ‘OK’.
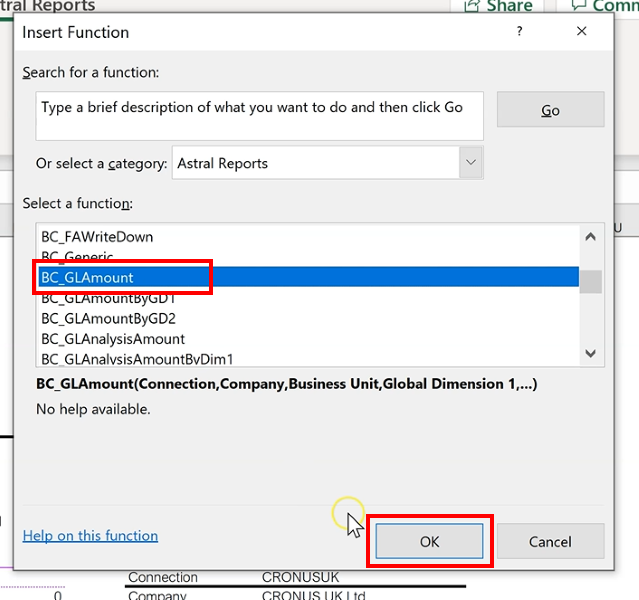
Figure 2
Now fill in the Function Arguments.
Select the ‘Connection’ and ‘Company’ from the spreadsheet, locking in the cells, and leaving the ‘Business Unit’ blank in this instance.
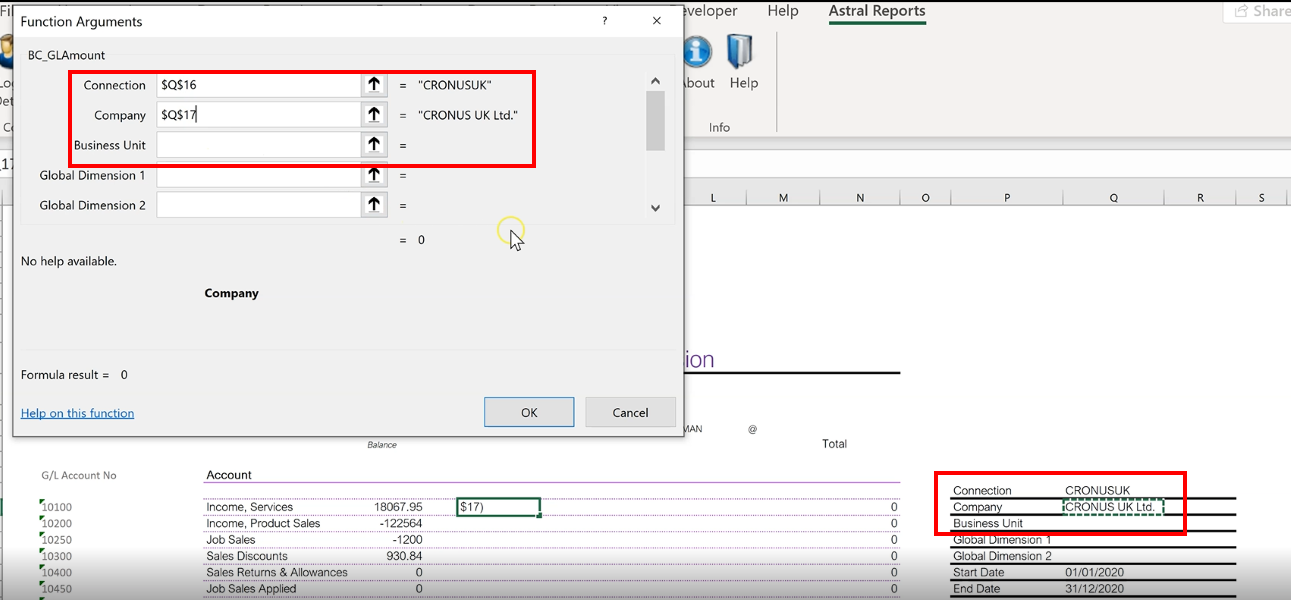
Figure 3
In this case the ‘Global Dimension 1’ is the ‘Department’, so select this value, lock the row but allow the column to freely move.
Leave ‘Global Dimension 2’ blank, specify the ‘Start Date’ and lock the cell, specify the ‘End Date’ and lock the cell.
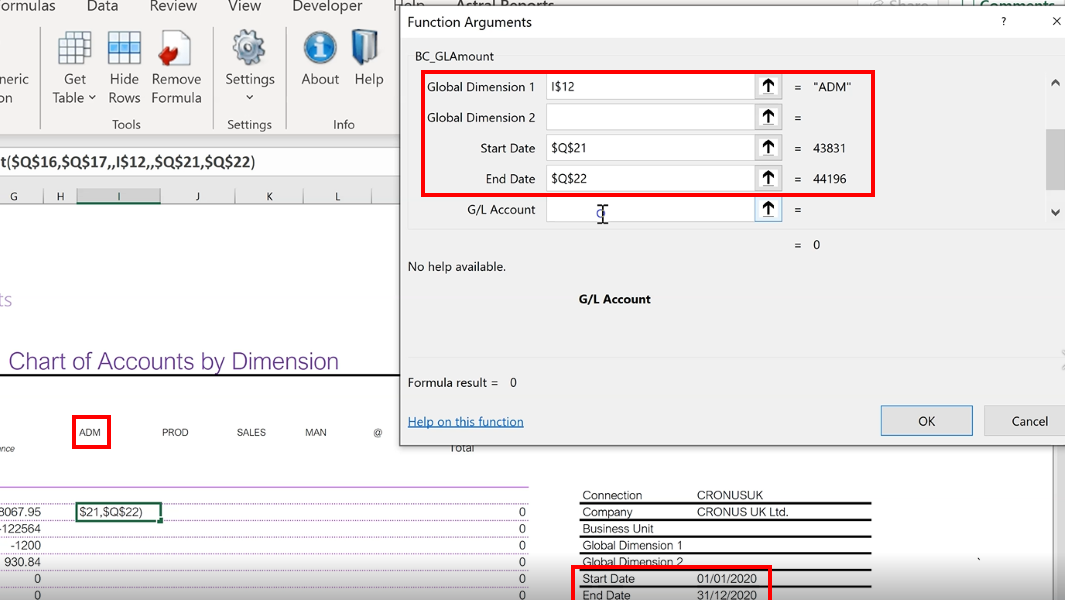
Figure 4
Select the ‘G/L Account’ but lock it so that the function can be copied down on the spreadsheet.
Leave ‘Additional Currency’ blank, and click ‘OK’.
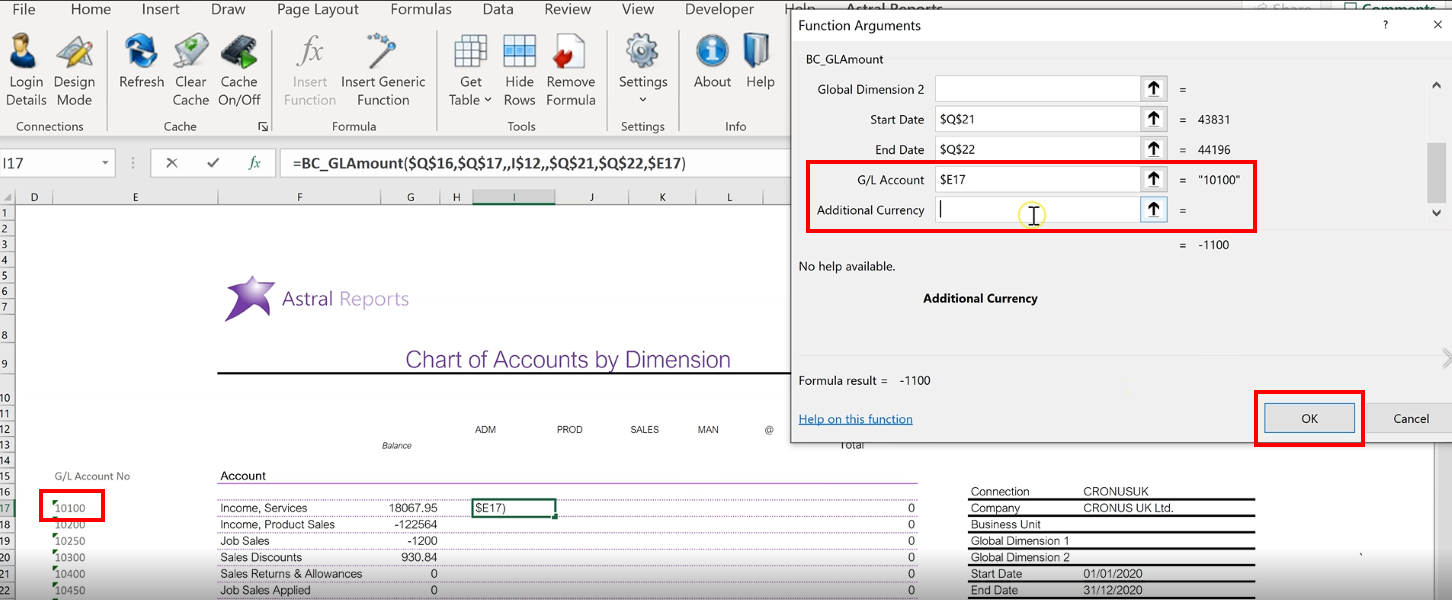
Figure 5
Now drag the formula along to populate the remaining values.
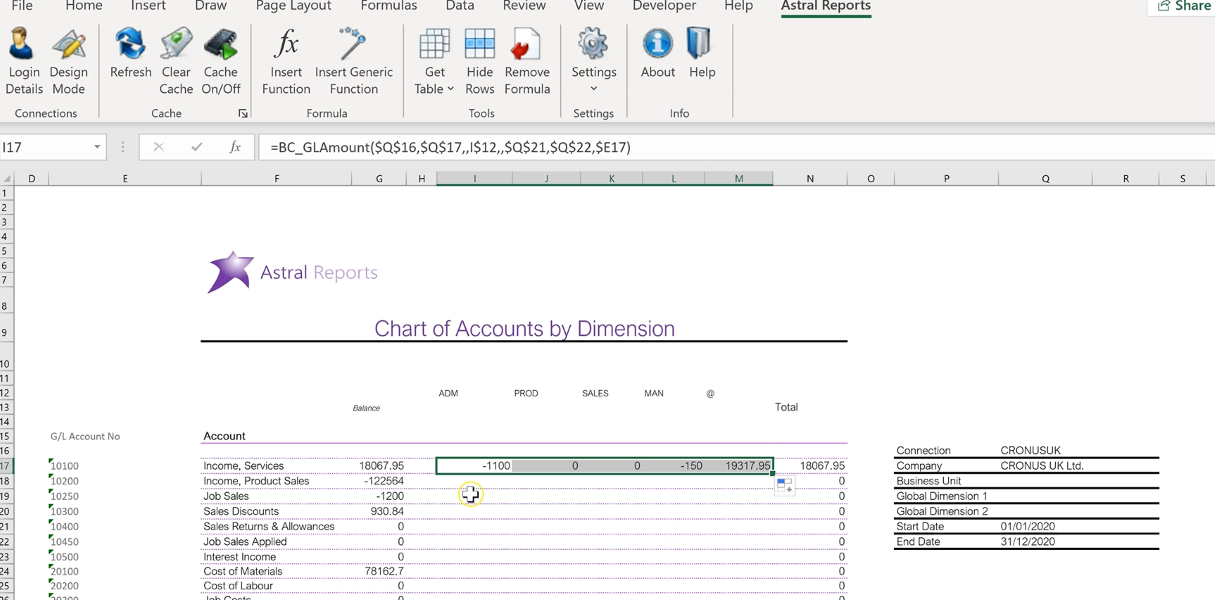
Figure 6
Clicking into one of the cells, you can see the functions that have been taken into account to calculate the figure.
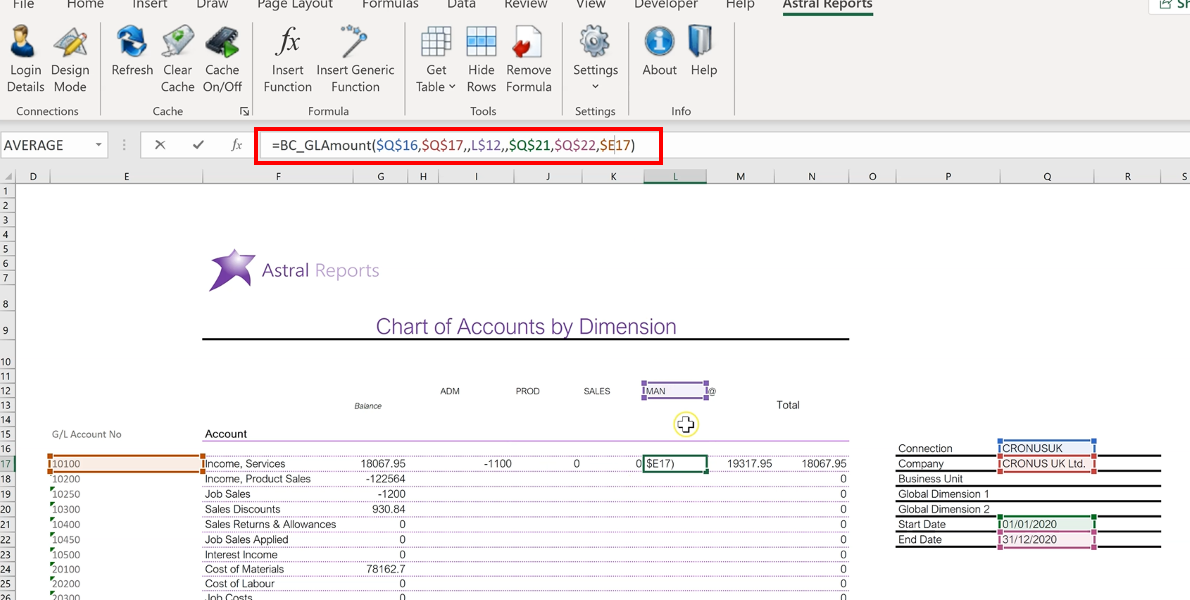
Figure 7
Now, highlight the row, and drag it down to copy the formula into the remaining cells.
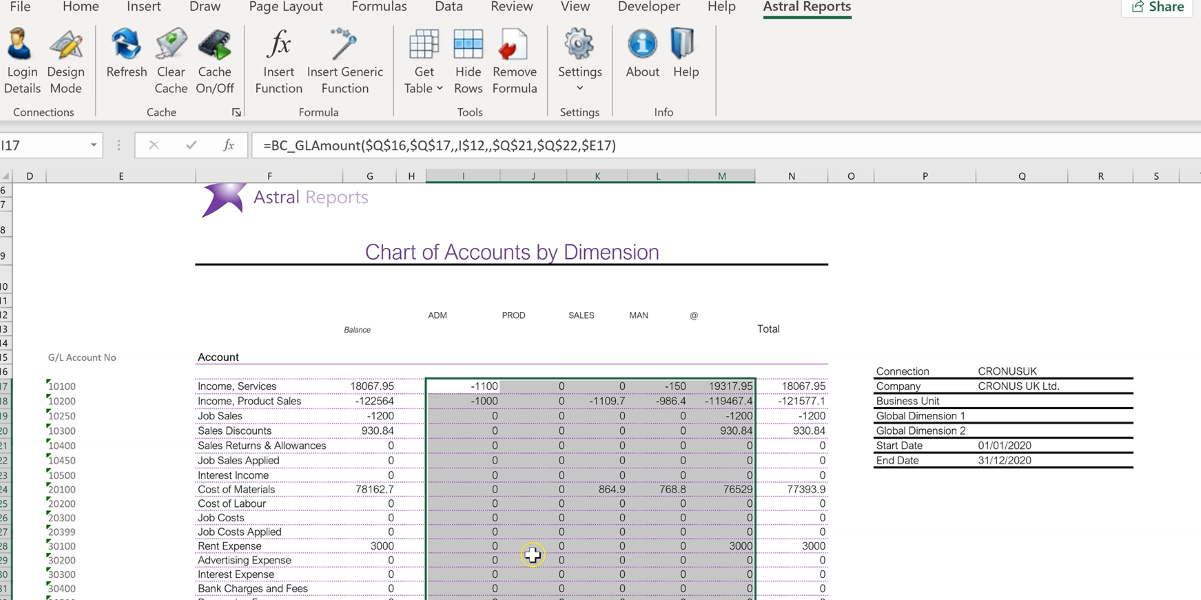
Figure 8
Note the value in the column on figure 9.

Figure 9
This value represents anything outside of your dimension values, or anything posted with no dimension.
In this example, there are the dimension values; ‘ADM’, ‘PROD’, ‘SALES’ and ‘MANUFACTURIG’. Whereas this column represents anything that has been posted with no dimension values.
So this way you know that you have all the values for all the postings within the report.